Analysis
The figures are drawn by the module’s own code on a simulated sample
(scripts/docs_figures.py): a doublet split by 30 µeV at 775 nm next to a
single line at 776 nm, and the same doublet resolved into two lines.
① Every angle is checked
The stage reports its position only once it has settled. A position more than 0.01° from the target is commanded once more; a second miss fails the step, so no spectrum is ever recorded at the wrong angle. A step of up to 10° gets a 5 s window, a longer move 130 s, homing 180 s.
An acquisition is never repeated automatically — a repeat would expose the dot twice. The rig confirms instead that the spectrometer reported a new file.
The spectral map
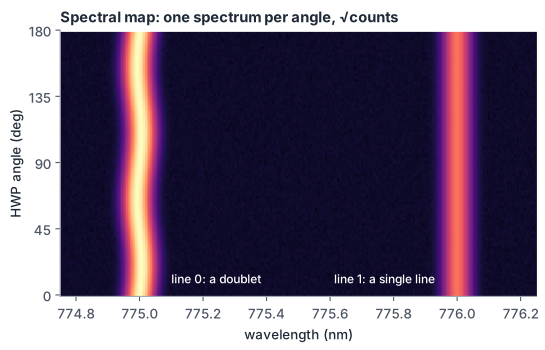
A doublet closer than its linewidth shows as one line. Its two components are polarized at right angles, so as the plate turns the polarizer passes more of one, then of the other, and the line’s centre swings between them every 90°. A single line stays where it is. The swing is a small fraction of the linewidth: it is measured by a fit, not read off the map.
② Fine structure
After the last angle of a dot, the FineStructure analyzer of
plesty-fss runs in two
stages: it fits every line in every spectrum, then a sine to each line’s
centre against the angle.
Fitting the lines
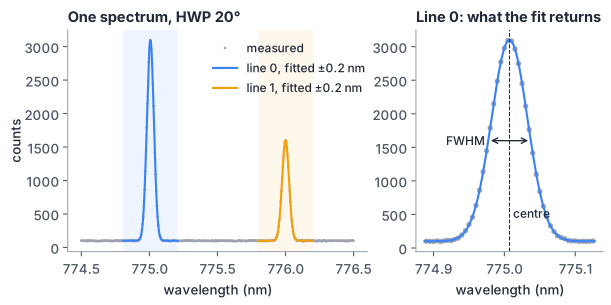
plesty-lib’s SpectrumFit, with analysis.fit_options:
Find the lines in the mean of all the sweep’s spectra — or, with
average: median, their per-pixel median, which a cosmic ray in one spectrum does not survive.peaksnames them;prominencefinds every maximum standing that many counts above its surroundings.Group lines closer than
overlap(default 2) times the larger FWHM: those are fitted together, every other line alone.config/demo.yamlsets it high, so all its lines are fitted together.Fit each group over
windowbeyond its outer lines on each side — without one, halfway to the neighbouring groups: a Gaussian per line (model) on a linear background, by non-linear least squares. The result is each line’s centre, FWHM, height and area, each ± σ.Follow the lines through the sweep: the fit to the average seeds the first spectrum, each spectrum’s fit seeds the next, in angle order; with a
windowthe range moves with the line.center_tolerancekeeps each centre that close to its seed. A spectrum whose fit fails is left out.Count the signs of a fit that lost its line — failed fits, a centre or width at its bound, jumps wider than the line, outlying centres — and name every such line in
warnings. Nothing is changed by the count.
|
does |
|---|---|
|
follow the lines named, in nm |
|
follow every line found that far above its surroundings in the median spectrum |
|
how much spectrum each fit sees beyond its lines, in nm |
|
how far a centre may move from one spectrum to the next, in nm |
|
the FWHM range a line may take, in nm |
|
when lines are fitted together; the line shape — |
Fitting the fine-structure curve
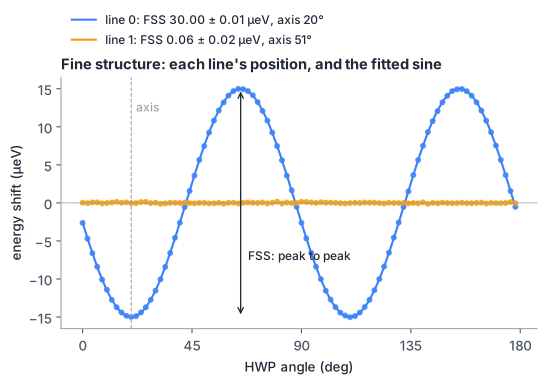
Each line’s centres are fitted with
centre(θ) = mean + A · cos(k · (θ − axis))
where k comes from analysis.rotator: 4 for a half-wave plate (a 90°
period), 2 for a rotating polarizer (180°). Written as
mean + a·sin(kθ) + b·cos(kθ), the model is linear in mean, a and b, so
the fit is a weighted linear least-squares solve — no starting values, nothing
to fail to converge. Each centre is weighted by 1/σ² of its line fit, and the
errors are scaled by the reduced χ².
FSS = 2A, the peak-to-peak, turned into an energy at the mean position: ΔE = hc · 2A / mean², in µeV, its error from the fit’s full covariance.
axis = atan2(a, b) / k: the plate angle where the line sits at its longest wavelength — its lowest energy.
fss_valid= 2A is smaller than the line’s median FWHM. A swing as wide as the line means the fit followed different lines, not one doublet.Fewer than four fitted spectra leave everything
nan.
What it reports
Output |
Holds |
|---|---|
the dot’s analysis record in |
per line |
|
every line’s fit in every spectrum: centre, width, height, their errors |
|
per line the FSS, axis and mean centre with errors, the fit’s R², |
|
a sentence, a table of the lines and the sweep drawn |
The saved outputs load with ExperimentData.load. The report renders with
plesty.lib.report.Report.load(path).to_html(), without importing plesty-fss.
How to read them
A good result — the figures above. The map shows the doublet as one line
with a gentle 90° wiggle. In the fine-structure plot the points lie on the
sine; the FSS is many times its error, and warnings is empty. A single line
gives an FSS indistinguishable from 0.
A doublet resolved into two lines — no splitting to trust:
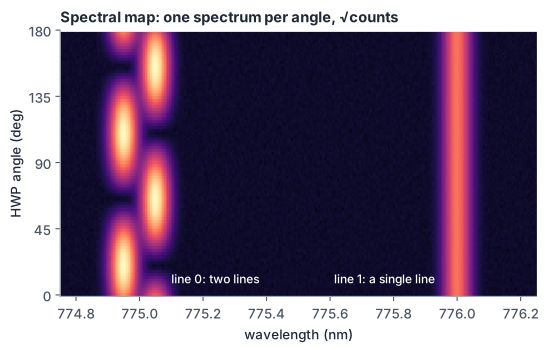
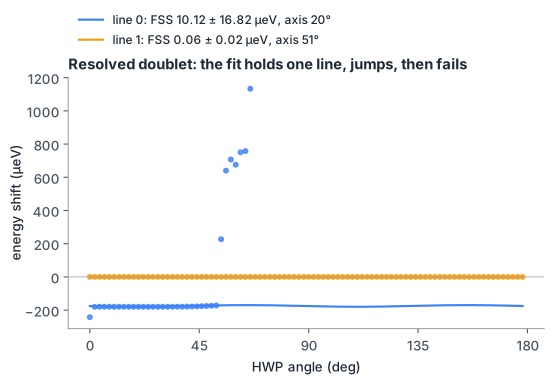
The map shows two lines handing the intensity back and forth instead of one
line swinging. The fit of line 0 holds one of them, jumps when its intensity
fades, then stops converging; the FSS comes out smaller than its error and the
analysis names the line in warnings. A line whose centre swings by at least
its linewidth is marked fss_valid: false. Either way, the splitting is the
distance between the two lines, read off the spectrum — not this fit.
You see |
It means |
|---|---|
points on a clean sine, error ≪ FSS |
a splitting measured |
flat points, FSS ≈ 0 within its error |
an unsplit line, or the axis along the polarizer |
scattered points, error ≥ FSS, a warning |
the fit lost the line: resolved doublet, a neighbour, or too weak — check |
|
the swing is as wide as the line: not one line any more |